| 56.2% |
10.5 hrs |
13.5 hrs |
2,393 kWh |
|
Projected Runtime Reduction
|
Projected Generator-On Time
|
Projected Generator-Off Time
|
Energy Delivered In 12 Hours
|
EXECUTIVE TAKEAWAY
EBOSS isolated the production load from generator cycling. The inverters handled the difficult electrical demand continuously, allowing the generator to operate as a controlled charge source rather than directly following every load change.
Measured and Projected Results
| Performance Measure |
Result |
Basis |
| Average Real Load |
199 kW |
Measured |
| Measured Peak |
268 kW |
Measured |
| Average Apparent Demand |
413 kVA |
Estimated from 480V and Reported Current |
| Average Estimated Power Factor |
0.48 |
Estimated |
| Projected Daily Energy |
4,786 kWh |
Measured Period Repeated for 24 Hours |
| Projected Generator Runtime |
10.5 Hours |
43.8% of the day |
Customer Environment
The application was an automated industrial material-handling environment with robotic equipment, conveyors, motors, transformers, variable-frequency drives, and energized controls. The customer and site identity were intentionally anonymized for external use.
The Challenge
A load that could not be evaluated by peak kW alone
• The 268 kW measured peak was paired with approximately 472 kVA at peak current, creating a much larger electrical burden than the real-power figure suggested.
• Reactive and nonlinear current remained high even when production demand declined, with an average estimated power factor of 0.48.
• A direct-generator solution would need to absorb motor transients, harmonic current, voltage recovery, and reactive demand while operating continuously.
• The site required reliable, uninterrupted production power plus visibility into load sharing, temperatures, runtime, and operating state.
WHY THE LOAD WAS DIFFICULT
At 199 kW and unity power factor, the equivalent current at 480 V would be about 240 A. Reported combined inverter current averaged approximately 497 A, indicating a substantial reactive or distortion-current burden.
The Solution
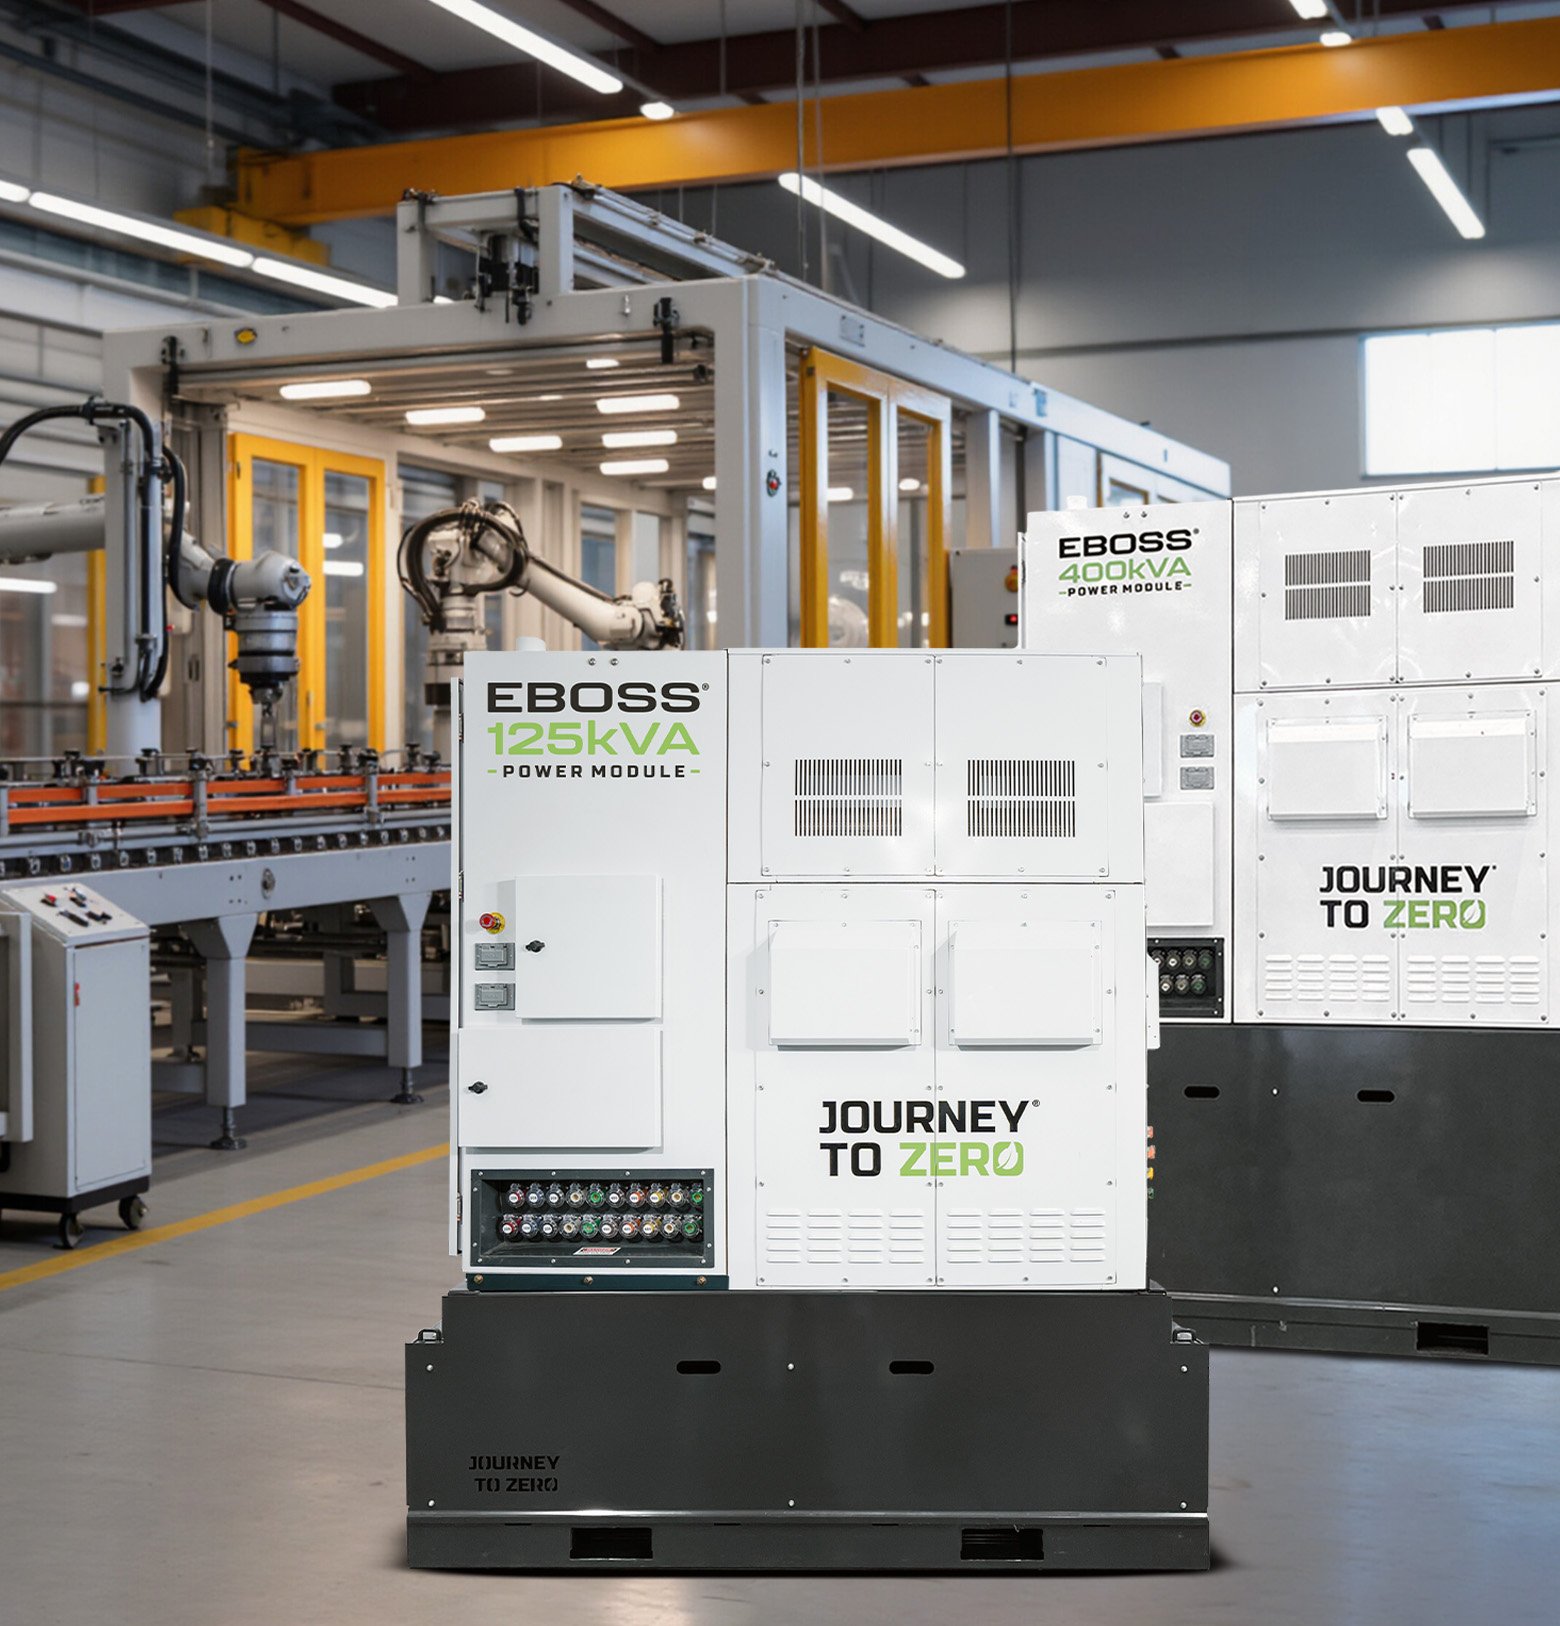
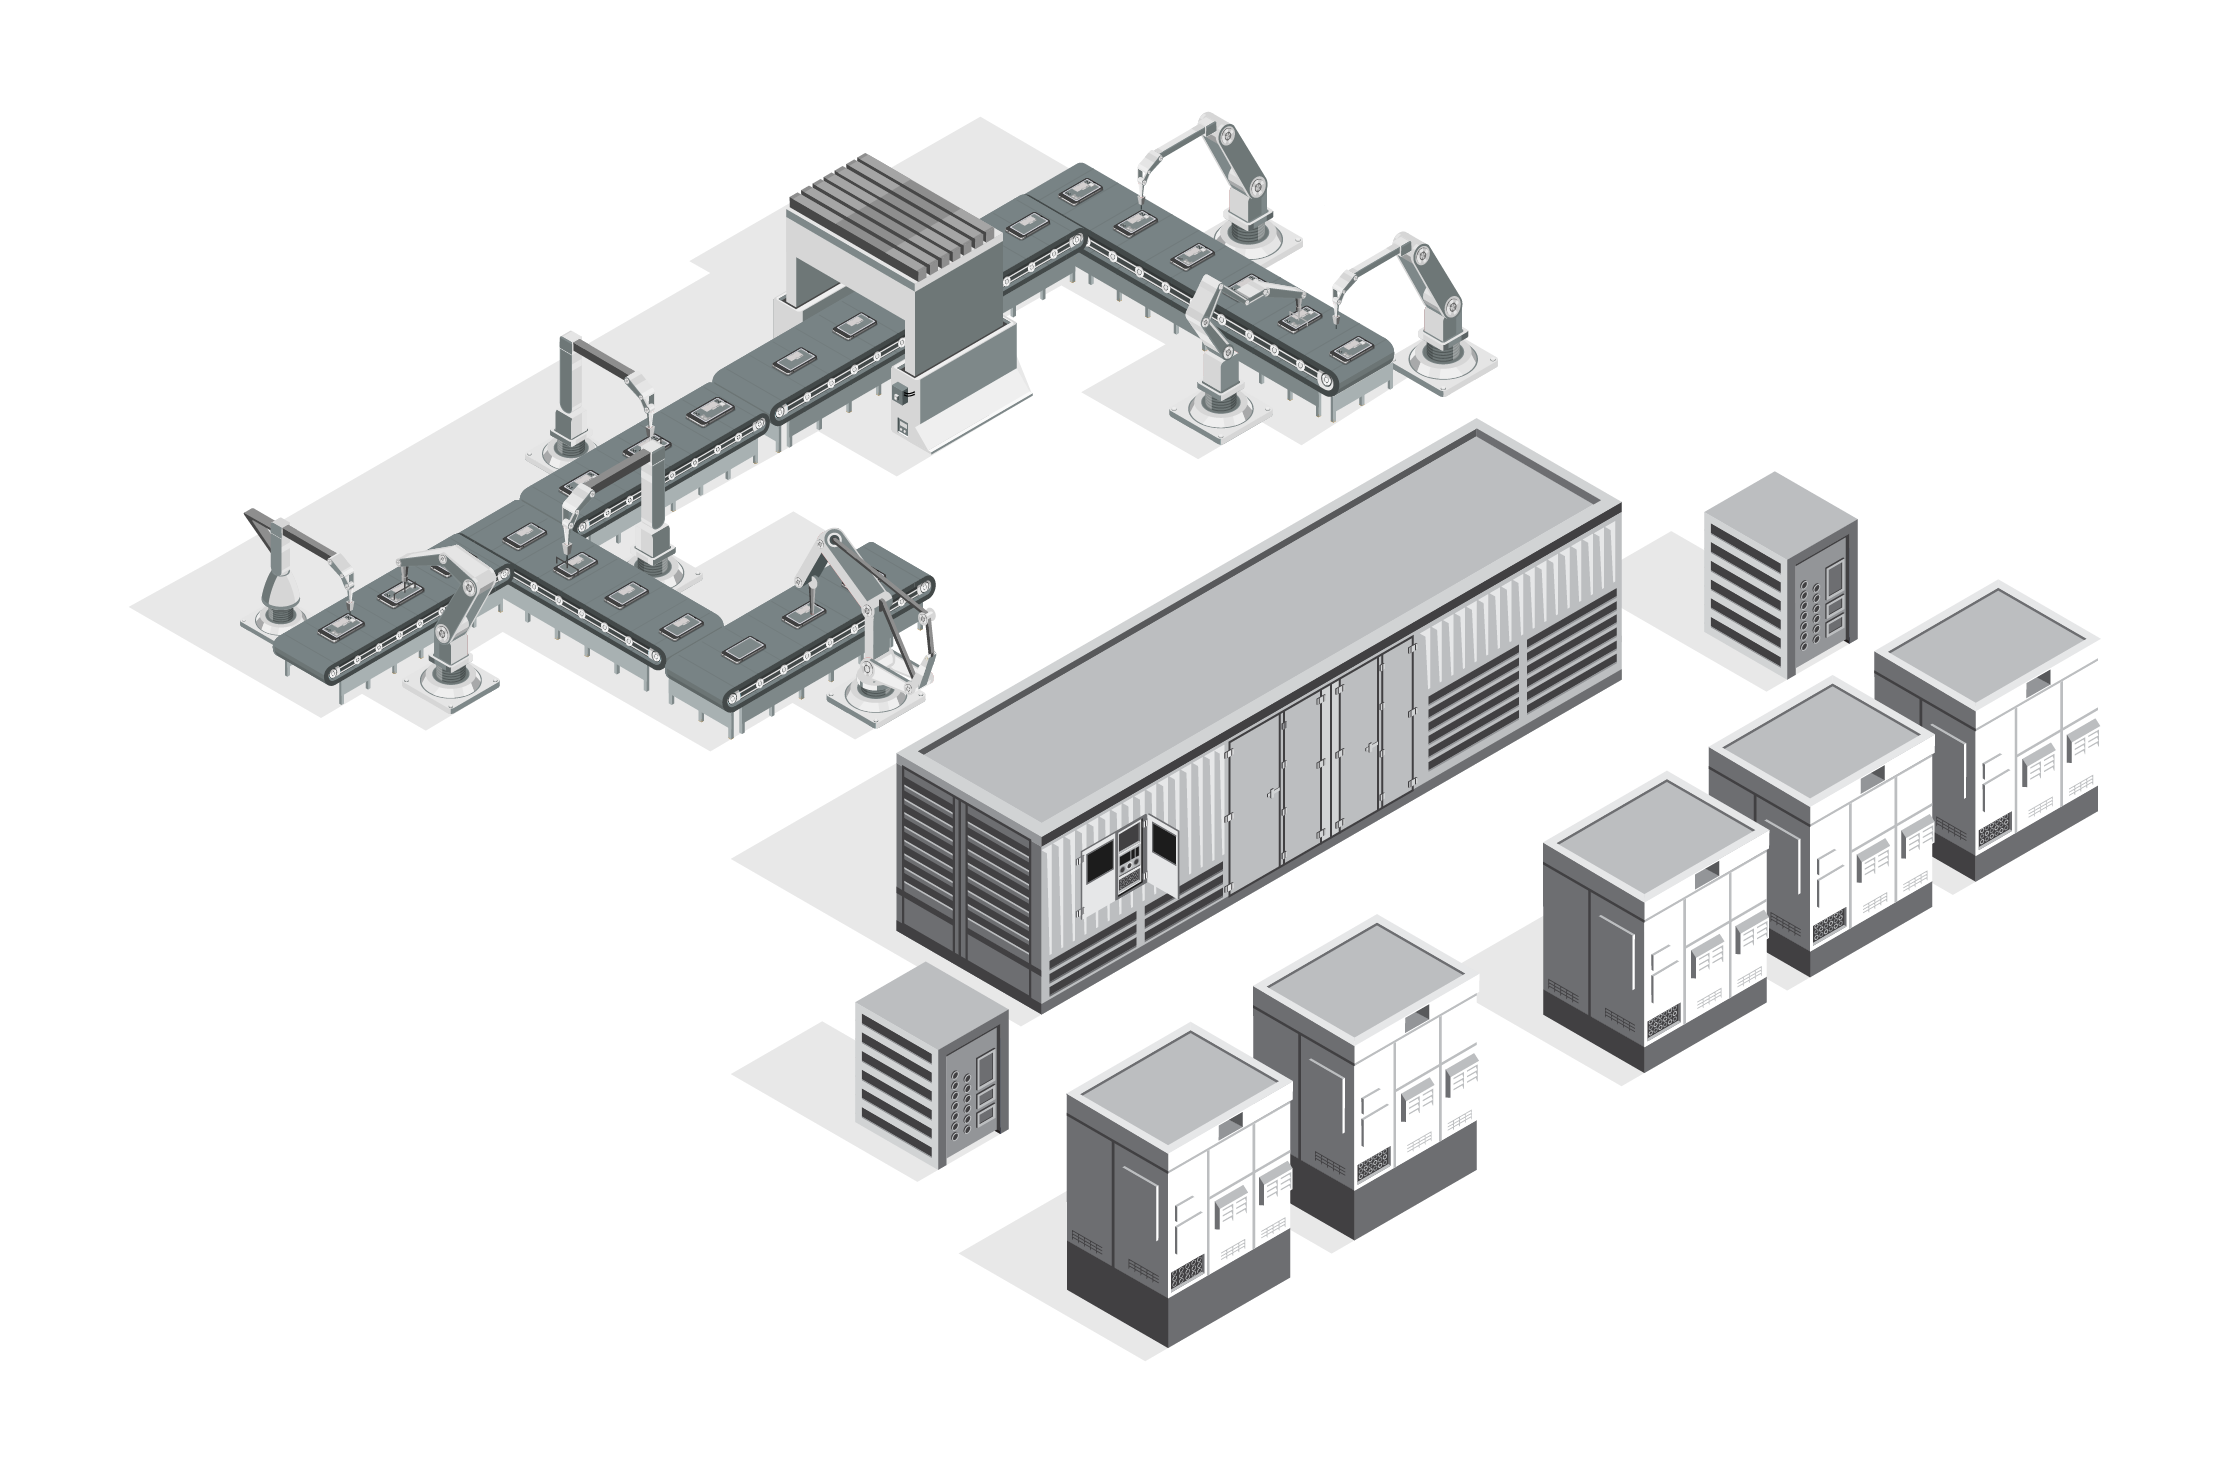
ANA deployed two EBOSS 400 kVA power modules and three EBOSS 125 kVA power modules in parallel on a common 480 V, three-phase bus. The five synchronized inverters continuously supported the robotic conveyor system, while the 1 MW generator supplied the active front ends and battery packs only during controlled charging windows.
How the Architecture Worked
Stage
|
Function
|
Operational effect
|
|
1. Generator charging
|
Generator supplies the AFEs and battery packs
|
Engine runs in defined charging windows
|
|
2. Battery/inverter operation
|
Five inverters remain synchronized on the common bus
|
Production load sees continuous inverter power
|
|
3. Generator-off interval
|
Batteries continue feeding the load
|
Runtime, noise, and service-hour accumulation stop
|
|
4. Telemetry feedback
|
Operating data informs charge rate and SOC settings
|
Field settings can be optimized without compromising uptime
|
Why EBOSS
• Separates production-load behavior from generator operation, allowing the engine to charge at a controlled operating point.
• Provides synchronized inverter support for reactive, nonlinear, harmonic, and transient current demands.
• Uses integrated telemetry to monitor load, current, runtime, synchronization, temperature, and operating state.
RELIABILITY-FIRST VALUE
The primary benefit is not simply turning the generator off. The value is maintaining production-ready power while controlling when and how the engine operates, then using telemetry to validate runtime avoided, service-hour reduction, fuel use, and power-quality performance.
The Results
Across 721 synchronized one-minute records covering 12 hours, the five paralleled EBOSS units delivered approximately 2,393 kWh and maintained the robotic conveyor load without transferring production control back to the generator. If the measured operating pattern repeats over a full day, the system is projected to deliver 4,786 kWh while limiting generator operation to approximately 10.5 hours.
| 199.4 kW |
251.5 kW |
268 kW |
56.2% |
| Measured Average |
Highest 60-Min Average |
Recorded Peak |
Projected Runtime Avoided |
Operational Outcomes
• Projected generator-off time of 13.5 hours per day compared with a conventional generator operating continuously.
• Continuous inverter power isolated the production bus from generator starts, stops, cycling, and transient response.
• A sustained overnight/base load near 153–157 kW demonstrated that demand did not fall close to zero during reduced production.
• Telemetry confirmed that the system remained synchronized while identifying future optimization targets for reactive-current management, charging efficiency, and thermal margin.
Conventional Generator vs. EBOSS
|
Design Consideration
|
Conventional Generator
|
EBOSS Hybrid Architecture
|
|
Connection to load
|
Directly follows every load change
|
Inverters continuously support production bus
|
|
Engine runtime
|
24 hours per day
|
Projected 10.5 hours per day
|
|
Reactive/transient response
|
Alternator and AVR absorb full burden
|
Inverter system isolates generator
|
|
Noise and service hours
|
Continuous
|
Paused during 13.5 projected generator-off hours
|
|
Optimization data
|
Added monitoring typically required
|
Integrated telemetry supports adjustments
|
Why This Matters
This deployment shows why industrial temporary-power systems must be evaluated in kW, kVA, amperage, power factor, energy, and load behavior—not by peak kW alone. The same approach can be applied to automated warehouses, manufacturing lines, conveyors, robotic cells, and other industrial sites with variable production loads, high reactive demand, or a need to reduce continuous generator operation.
Transferable Value
• Scalable architecture: multiple EBOSS power modules can operate as one synchronized source for larger or more complex applications.
• Controlled engine operation: generators can be scheduled around charging needs instead of following every production-load change.
• Measurable performance: telemetry supports validation of runtime, service hours, power quality, charging behavior, fuel use, and emissions impact.
Field Performance Takeaway
EBOSS handled the difficult load first. The next optimization cycle should convert that successful operation into a fully reconciled 24-hour dataset with verified fuel, runtime, power-quality, and service-impact results.
Next Step
Bring ANA your next complex temporary-power application. Our team can evaluate the full electrical load profile and help determine where a generator-backed hybrid system can improve uptime, reduce engine runtime, and simplify field operations.
Learn more at anacorp.com/hybrid-energy-systems.
Note: The 24-hour energy and runtime values are projections based on repeating the measured 12-hour profile. A complete measured 24-hour export and verified fuel data should be obtained before publishing final customer savings or equipment-sizing claims.